Here, in this Pdf, we will go through the stats section of Vidvee.
So, my friends in the stats section, you can check all the statistics to track how your videos are performing
Let’s begin by selecting stats option on the left side in the menu:
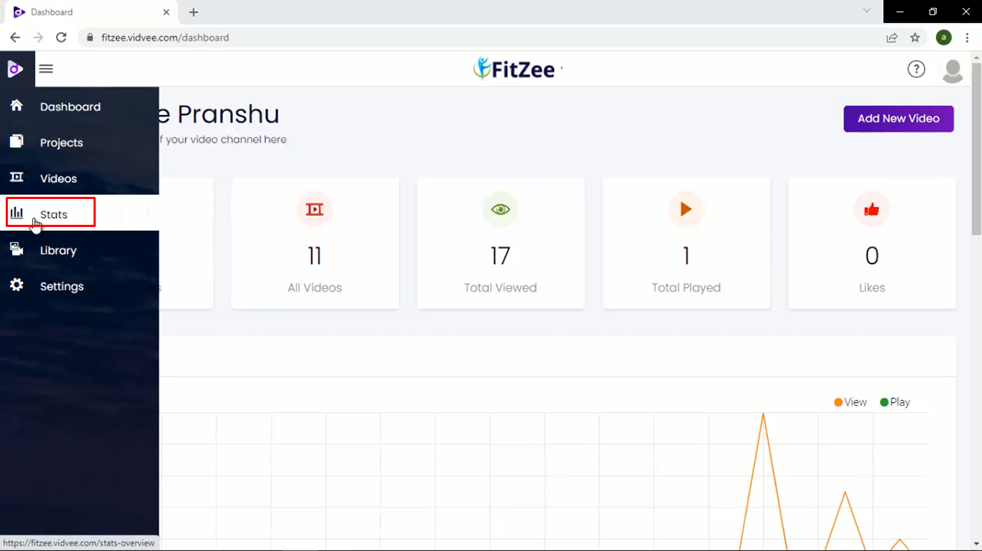
Here, five options are available:
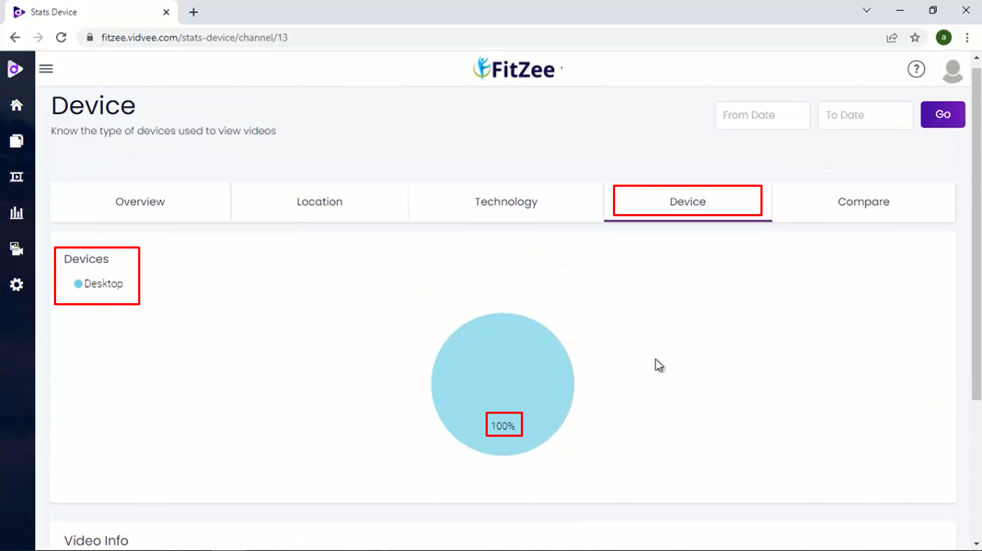
Overview, location, technology, Device, and compare.
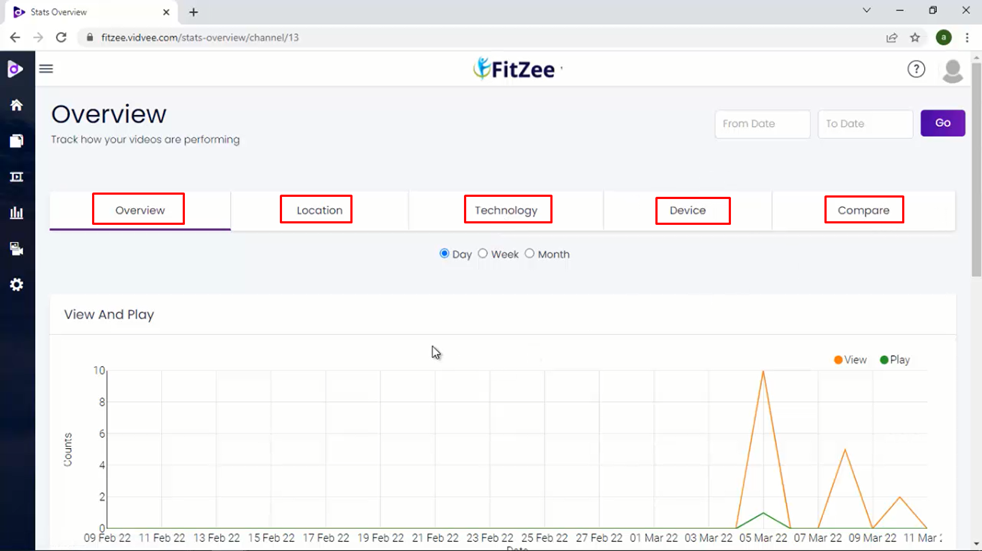
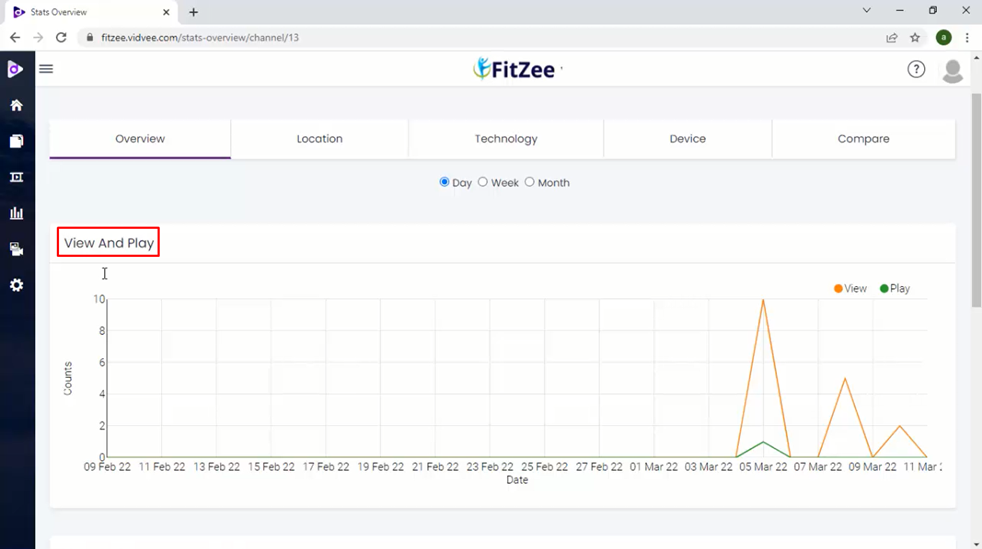
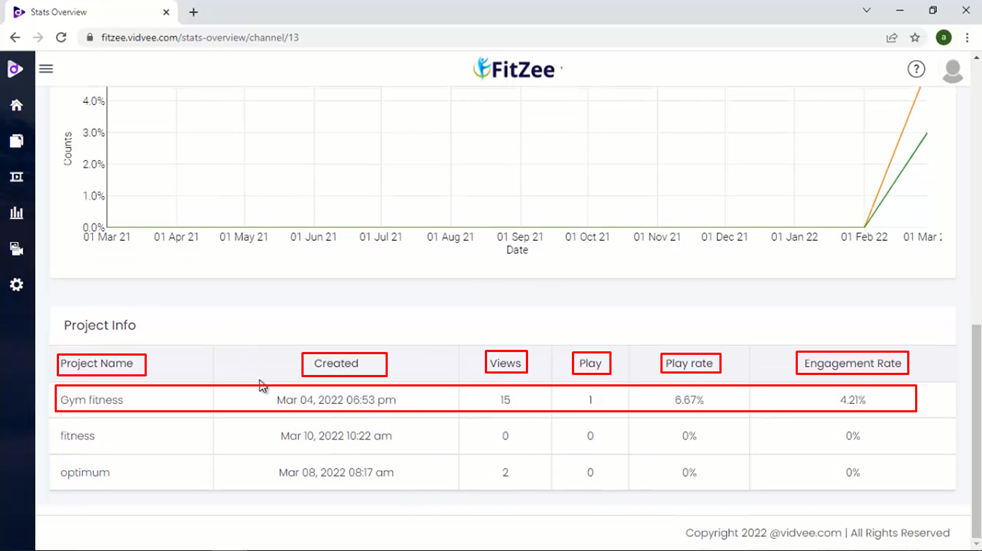
Now, Select the overview Option. Here we will get details of view and play within the graph form where we will see the number of counts per day, week, or month.
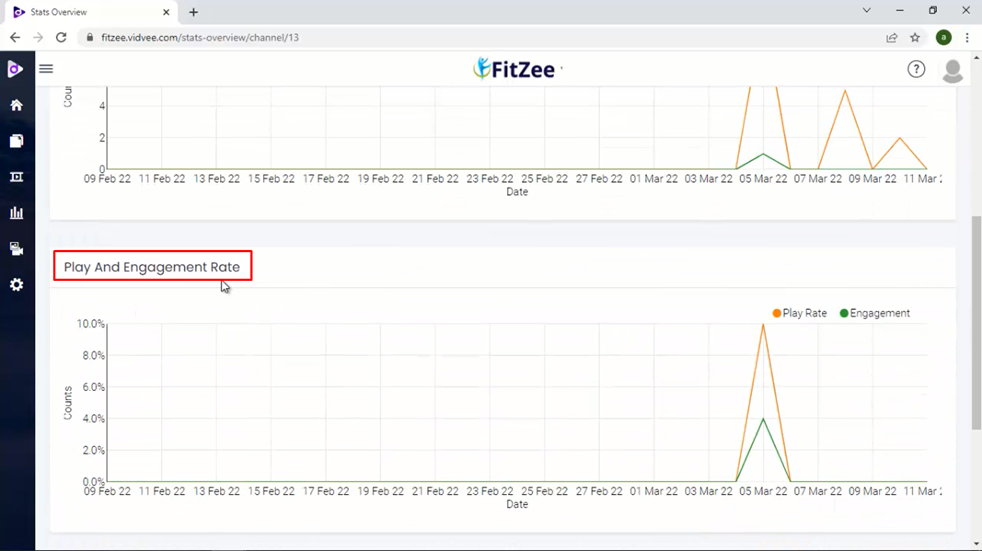
Then just below it, we can check play and engagement rate counts in the graph form where we will see the number of counts per day, week or month.
Here,
Under project info, we will get the project name, created date, number of views, play, play rate, and engagement rate.
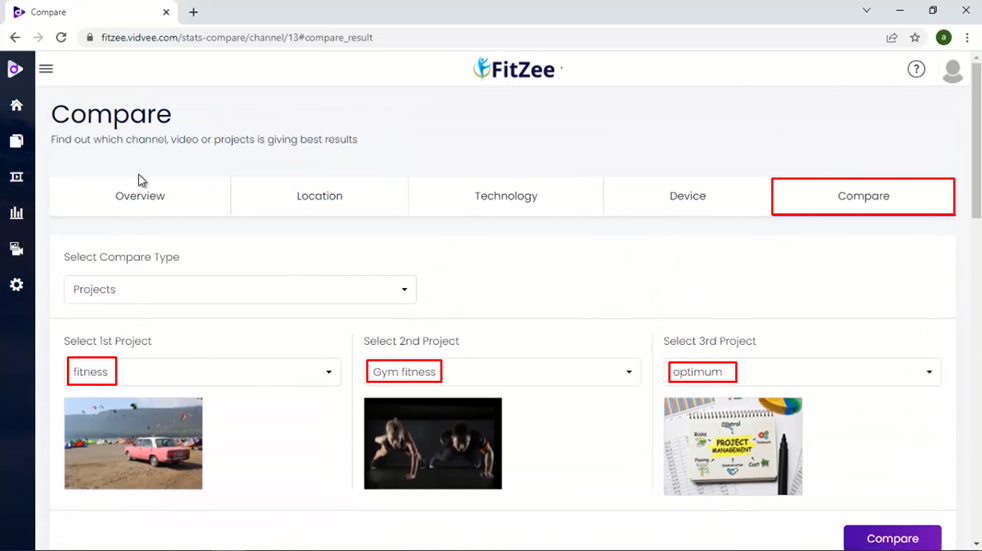
Now let’s go to the last stats option compare. Here you can select compare types which can be projects or videos. For now, we have selected compare the projects, select the project one option and then select the two projects and also select the project third now click on compare button.
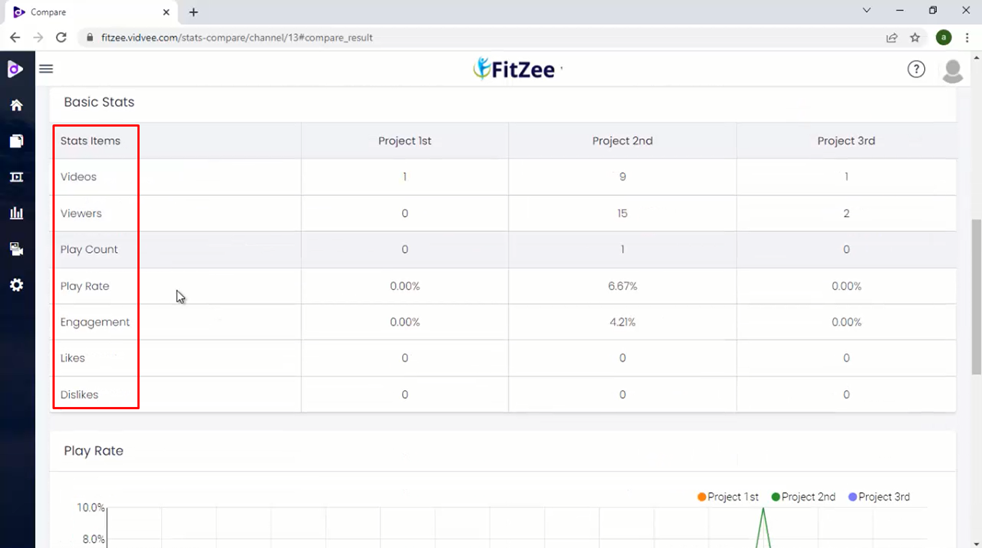
Here,
We will check basic stats like videos, viewers, play count, play rate, engagement, likes, and dislikes.
Now,
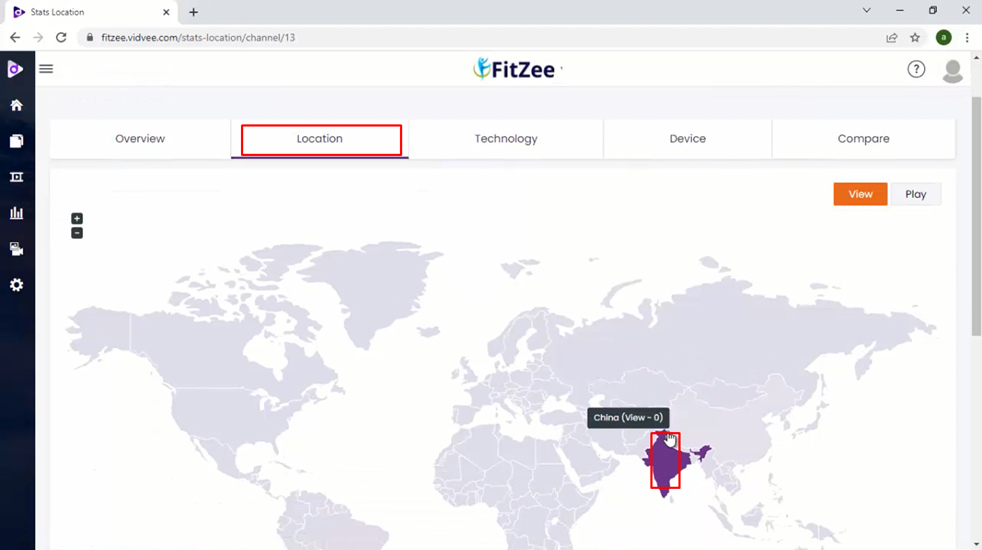
Click on Location. A map will open showing all the places from which traffic is received in the form of views and play.
On Next here click on technology. Two pie charts will be showcased showing operating systems and browsers used by users.
Was this article helpful?
That’s Great!
Thank you for your feedback
Sorry! We couldn't be helpful
Thank you for your feedback
Feedback sent
We appreciate your effort and will try to fix the article